
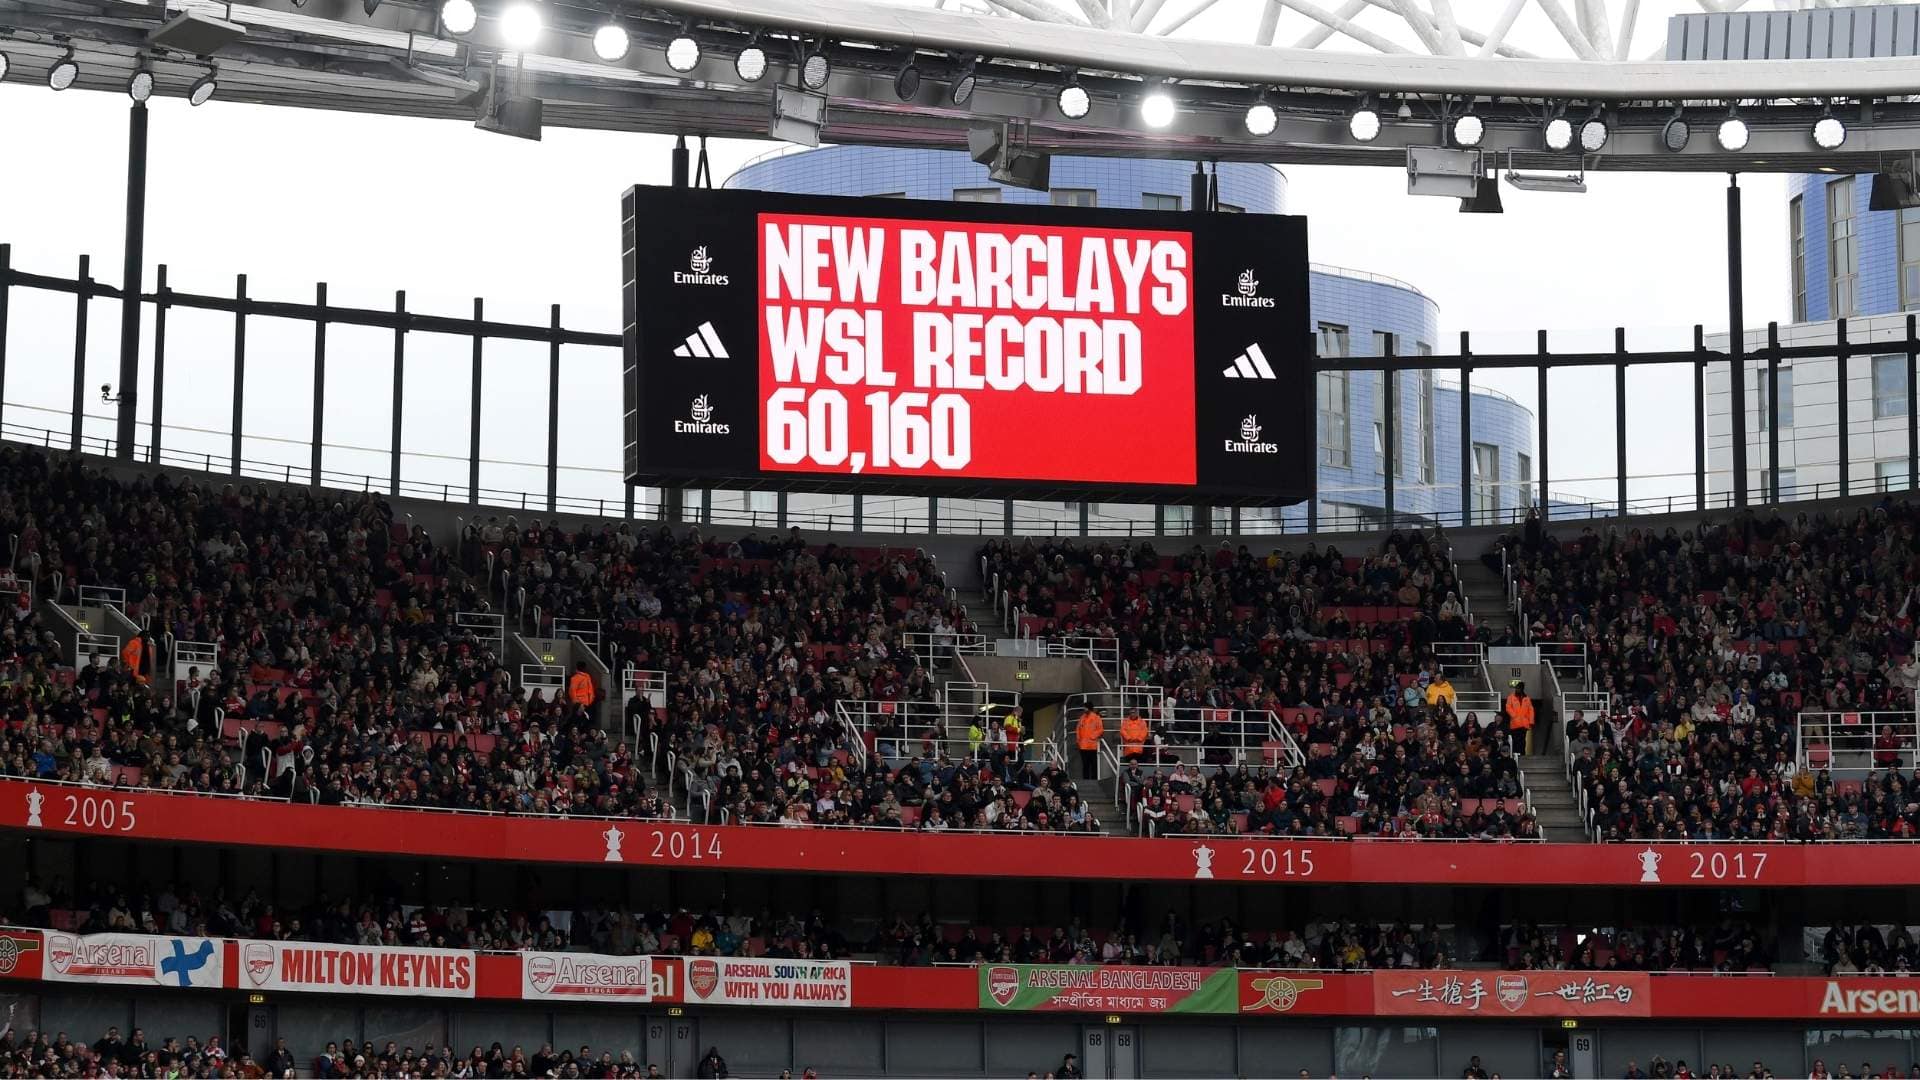
The WSL has never been louder about crowds. Every few weeks there’s a new record, a new milestone, a new headline image of a packed stadium doing the rounds on social.
But when you step back and look at the entire attendance picture – every match, every venue, every crowd from Gameweek 1 to Gameweek 12 – the story becomes far more revealing than any single sell-out.
Using verified attendance data from all played fixtures this season, here’s what the numbers are really telling us.
1. Arsenal are operating at a different scale

Let’s start with the obvious. Arsenal are miles ahead of everyone else.
They have hosted:
- 56,537 vs Chelsea
- 38,142 vs London City
- 37,627 vs Manchester United
- 34,345 vs Liverpool
- 27,336 vs Brighton
…across their home games so far, the five highest attended games this season. Their average attendance sits at 36,450.
For context:
- The league-wide average excluding Arsenal sits at approximately 4,000
- Arsenal are pulling eight times that figure on a regular basis
Five different opponents. Five massive crowds.
This matters because it shows demand isn’t limited to so-called “blockbuster” fixtures. Fans are turning up because it’s Arsenal at the Emirates – not just because of who happens to be visiting.
This isn’t a spike. It’s a system.
2. Sell-outs show what’s possible. Averages show sustainability.
Record crowds make headlines. Averages reveal infrastructure.
Highest average home attendances so far:
- Arsenal — 36,450
- Everton — 7,702
- Chelsea — 6,349
- Liverpool — 5,474
- Manchester City — 5,158
Only these clubs currently average meaningfully above the league average.
That gap matters when we talk about long-term commercial value, sponsorship confidence and broadcast leverage. One sell-out makes noise. Sustained turnout builds a business.
Home Attendance by Club 25/26 (GW 1–12)
| Team | Total | Average |
| Arsenal | 218,699 | 36,450 |
| Everton | 38,512 | 7,702 |
| Chelsea | 38,096 | 6,349 |
| Man City | 36,108 | 5,158 |
| Liverpool | 32,843 | 5,474 |
| Man United | 27,382 | 4,564 |
| Tottenham | 19,696 | 2,814 |
| Aston Villa | 18,632 | 3,105 |
| Brighton | 17,252 | 2,875 |
| Leicester | 12,284 | 2,457 |
| West Ham | 10,762 | 1,794 |
| London City | 10,445 | 2,611 |
| Season Totals | 480,711 | 6,799 |
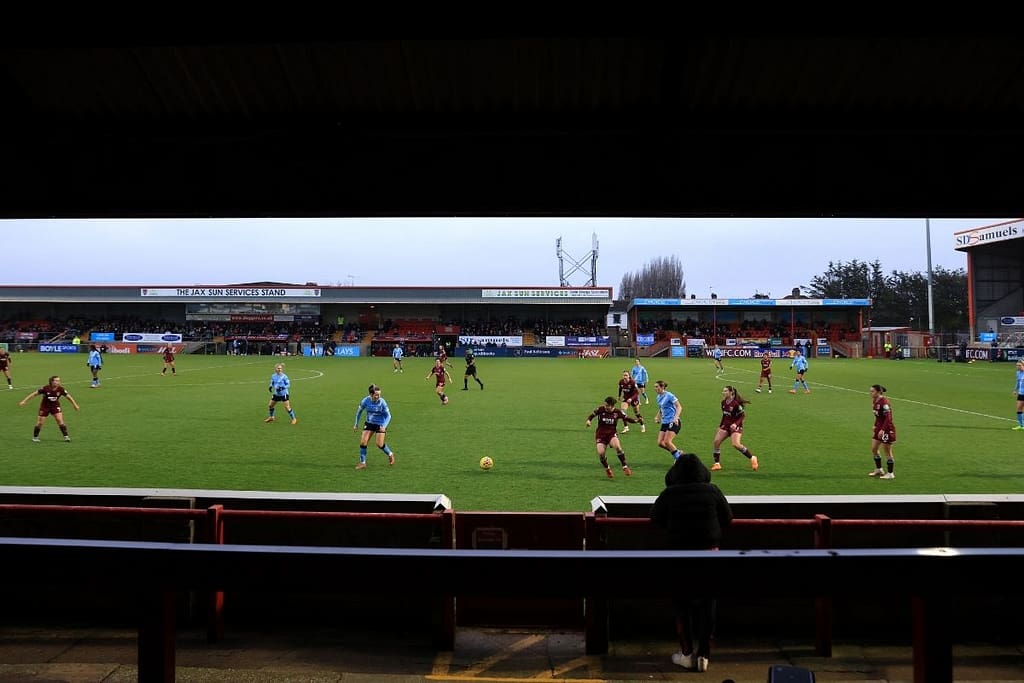
3. Venue choice can multiply attendance

One of the clearest patterns in the data is the venue effect.
Examples:
- Chelsea at Stamford Bridge: 14,182
- Chelsea at Kingsmeadow: ~3,000–4,000
- Everton at Dickinson Hill: 18,154
- Everton at Walton Hall Park (2024): ~2,500–3,000
Same teams. Same league. And in Chelsea’s case, same season.
The difference is access, visibility and intent.
In several cases, attendance jumps by six to eight times due to venue choice. Yes, opponents matter – but facilities do too when it comes to building an environment fans want to attend regularly.
4. Everton are quietly one of the WSL’s attendance success stories

Everton don’t dominate attendance headlines – but their numbers are among the most consistent.
Key figures:
- 18,154 vs Manchester United
- Multiple crowds above 6,000
- Average home attendance 7,702
That puts Everton second only to Arsenal in average turnout so far.
This isn’t accidental. It reflects deliberate use of Goodison Park and the new Hill Dickinson stadium in an approach that positions WSL games as major matchdays.
5. There is a clear attendance floor, and it sits at around 1,000–1,500
At the other end of the scale, several matches this season have recorded crowds between 1,100 and 1,700.
These fixtures typically share characteristics:
- Smaller venues
- Less marketing
- Midweek or lower-profile scheduling
This isn’t a failure – it’s a baseline.
Right now, the WSL operates with:
- A ceiling around 50,000
- A floor just above 1,000
This is one of the defining features of the league’s current phase, and the gulf is vast.
6. Consistency beats one-offs when you look at the full dataset
Some clubs rarely appear in “top five” lists – but they also rarely collapse below baseline.
Brighton, Aston Villa and West Ham regularly sit in the 2,000–3,500 range.
That may not trend on social, but it represents repeatable, dependable attendance – often more valuable than one-off records.
7. Total attendance is strong – but heavily weighted by Arsenal
Across the first 12 gameweeks:
- 480,711 total attendees
- 6,779 average per match
However, Arsenal at the Emirates account for a massive 45% of total attendance. Remove those fixtures and the total drops to ~262,000, with the average falling to ~4,000.
This doesn’t weaken the growth story. The league is growing, but that growth is concentrated rather than evenly distributed.
8. Attendance transparency is still incomplete and unnecessarily hard to track

One fixture this season – London City Lionesses vs Tottenham – has no publicly reported attendance, despite the match being played. There also doesnt appear to be a single source of truth across all attendance data. We had to use multiple reputable sources to pull the data in this article.
That matters.
In a league where attendance is increasingly central to the growth narrative, missing data:
- Skews averages
- Undermines analysis
- Limits commercial clarity
Growth stories rely on visibility. So does accountability.
9. The problem isn’t demand – it’s consistency
The data points to a simple truth.
When clubs:
- Choose accessible venues
- Market fixtures properly
- Treat WSL games as major events
Crowds follow.
When they don’t, attendance remains capped – regardless of talent on the pitch.
The league’s biggest challenge now isn’t convincing fans to care. It’s ensuring clubs are structurally set up to meet that care.
What comes next

The 2025–26 WSL attendance numbers don’t tell a single story – they tell several, happening at once.
Record-breaking crowds at the top.
Stable, modest growth in the middle.
Structural constraints at the bottom.
This is what a league in early transition looks like.
The data has already settled whether fans will turn up. The next phase will be defined by who is ready to build for them – consistently and at scale. That will require investment, not just in squads, but in infrastructure, venues and long-term planning that treats WSL matchdays as core business, not side projects.
👉 For more data-led analysis and perspective on the women’s game, explore our Opinions & Insights section here.